
Can a Doughnut make Sheffield fairer?
Doughnut lover? Doughnut hater? Can a Doughnut make Sheffield fairer?
SHEFFIELD DOUGHNUT
Emma Woods
3/28/20254 min read
Doughnuts. Soft, sugary, maybe filled with jam. You might be wondering how this sticky delight could make Sheffield fairer...
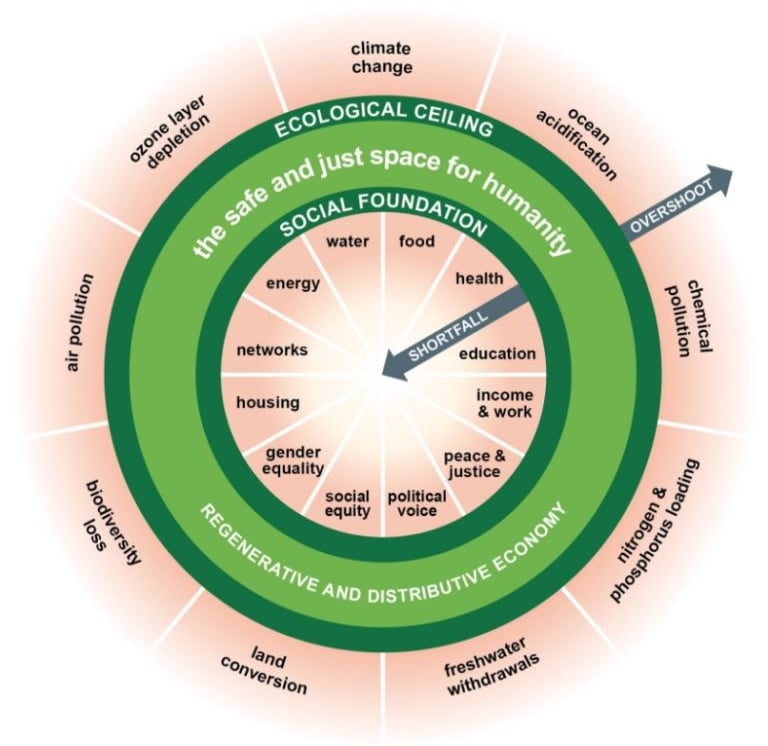
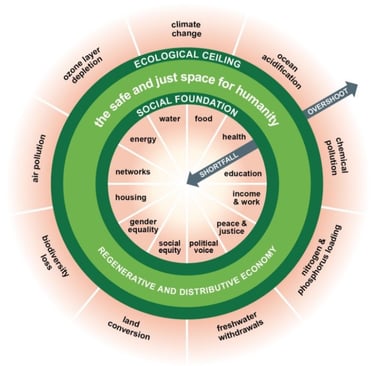
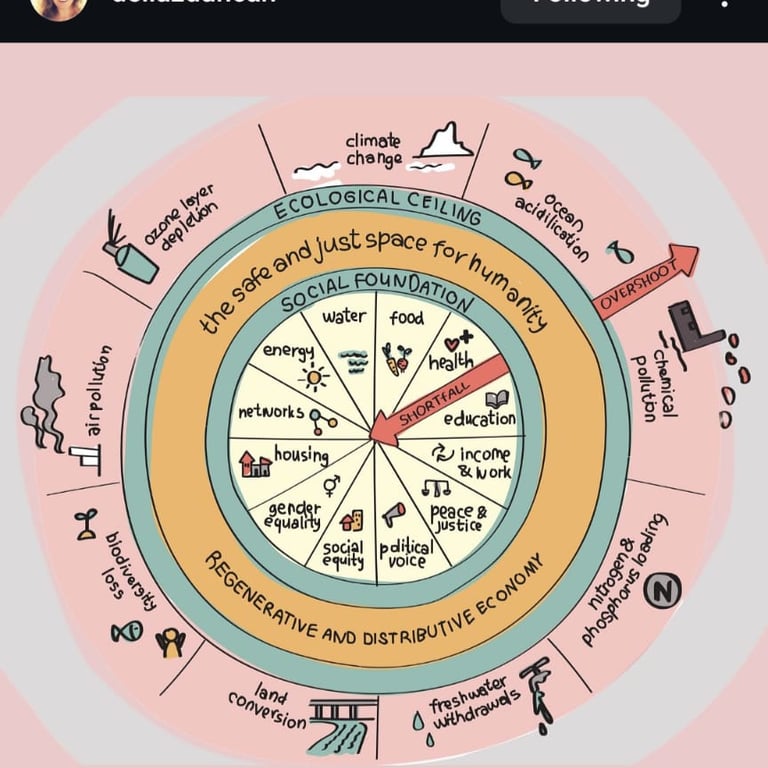
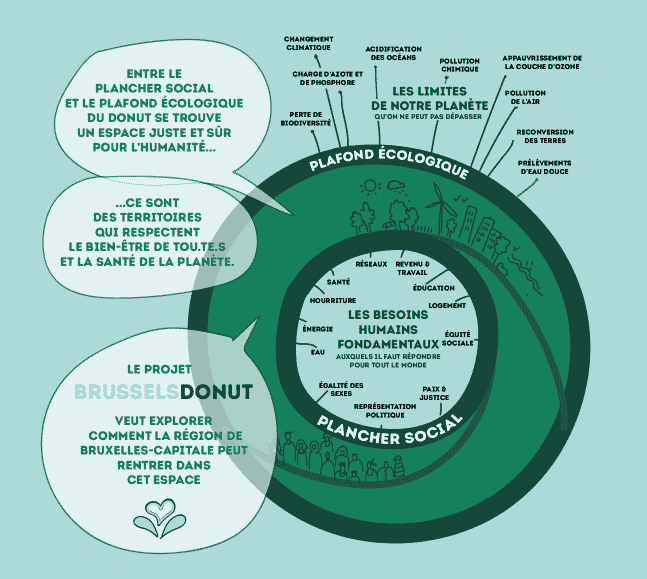
Around 15 years ago Kate Raworth realised mainstream economics wasn't working. She started playing around with ideas and eventually drew a pair of concentric rings. The inner ring was the social foundation of well-being that no human should fall below. The outer ring was an ecological ceiling beyond which lies planetary degradation that we should not go beyong. The space between these two circles is the safe and just space for all. This was the start of Doughnut Economics.
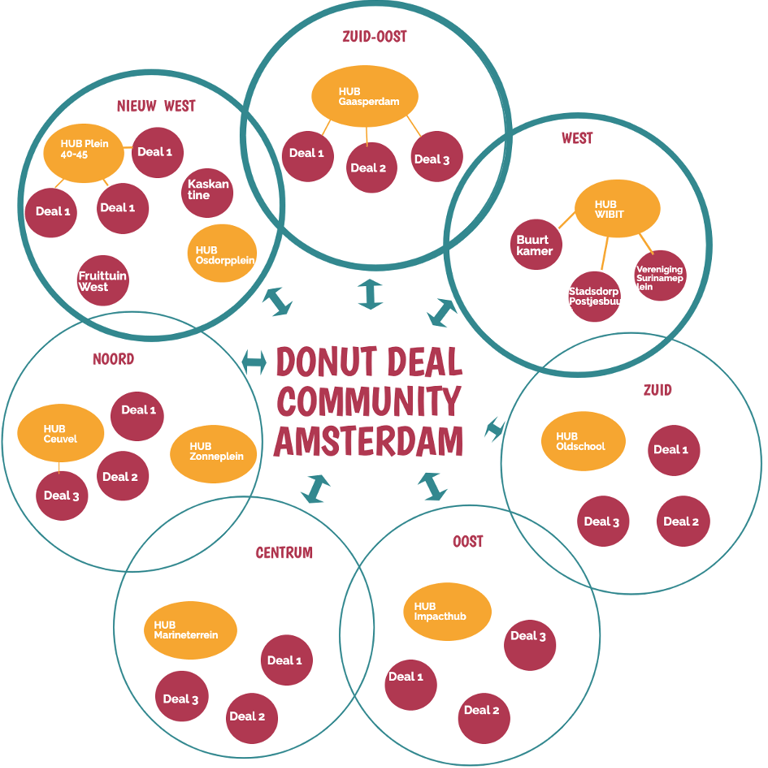
Since then the Doughnut Economics has spread across the world. The Doughnut Economics Action Lab was created to build a community of practioners and Doughnuts were created for cities and towns around the globe.
I was intrigued. Searching online I couldn't find a Doughnut for Sheffield so I had an idea, why not create one?
By chance the University of Sheffield approached me about hosting interns during the Easter holidays, and this felt like the perfect opportunity to start developing the Sheffield Doughnut.
Sean, Yan En and myself met at the start of their internship with lots of questions; which metrics should we use to estimate Sheffield's social foundation and ecological ceiling? What data was available at this localised level?
Sean Bowdin and Yan En Pang spent the next 3 weeks diving into the data; scouring the internet for disaggregated, robust data that could help us to paint a picture of Sheffield. A picture that didn't just focus on a narrow understanding of "the economy" but asked whether the city is meeting its residents basic needs but also remaining within planetary boundaries.
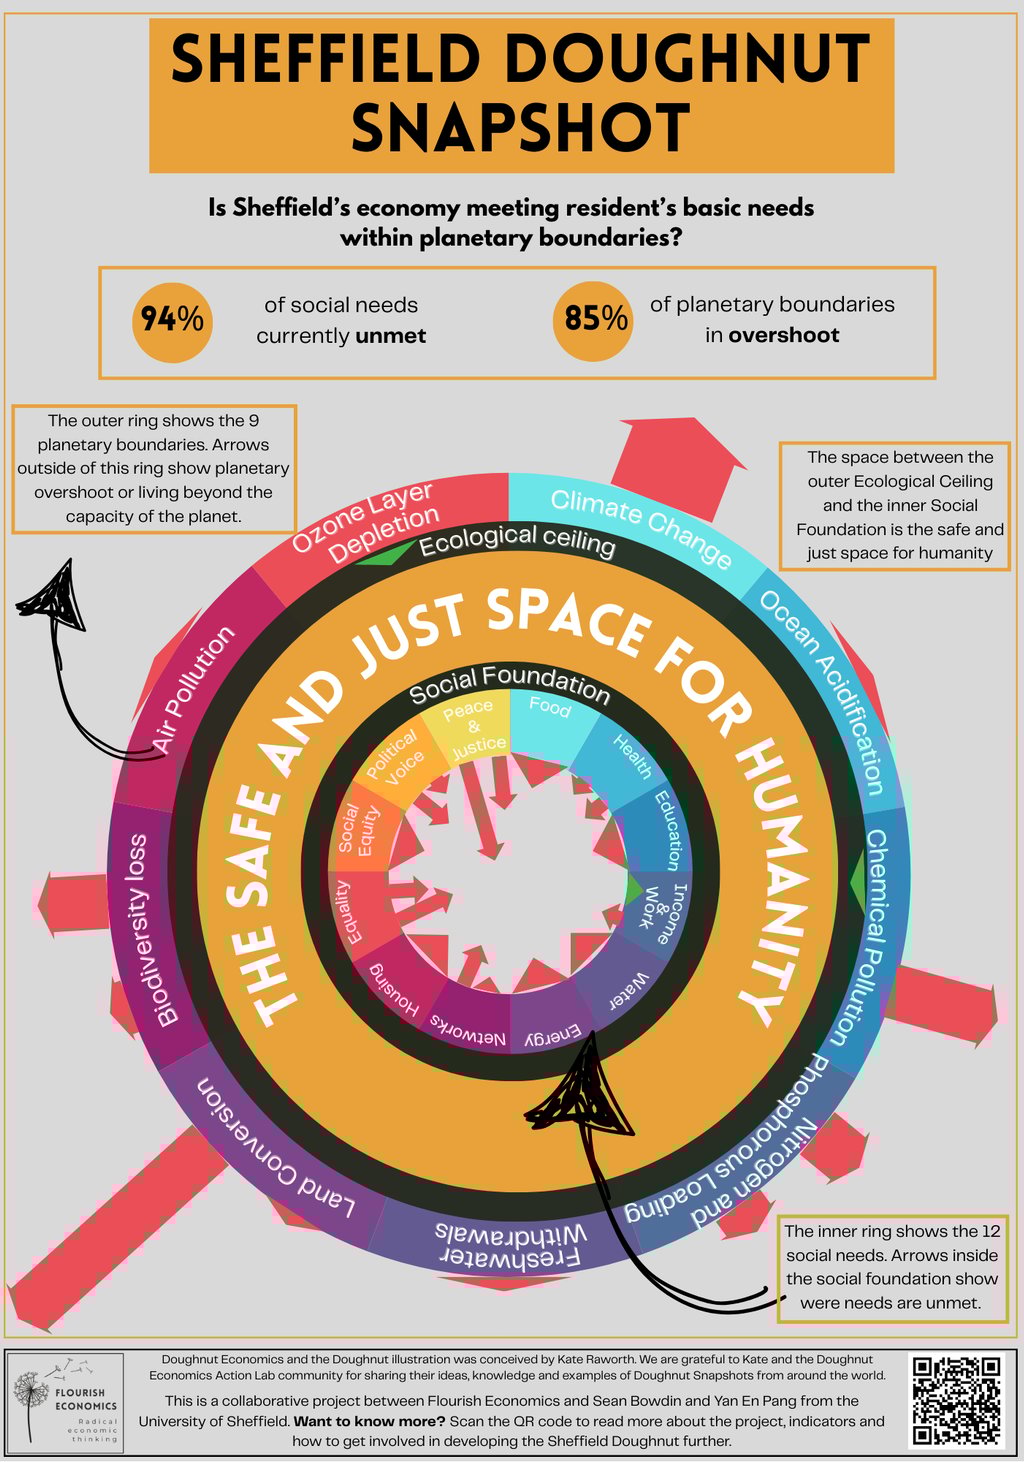
The 12 social foundation indicators and 9 ecological ceiling indicators from the Doughnut economics book served as a starting point. A recap for anyone unfamiliar with these;
The social foundation and its indicators of shortfall;
Food, health, education, income and work, water and sanitation, energy, networks, housing, gender equality, social equity, political voice, peace and justice
The ecological ceiling and its indicators of overshoot;
Climate change, ocean acidification, chemical pollution, nitrogen and phosphorus loading, freshwater withdrawals, land conversion, biodiversity loss, air pollution and ozone layer depletion
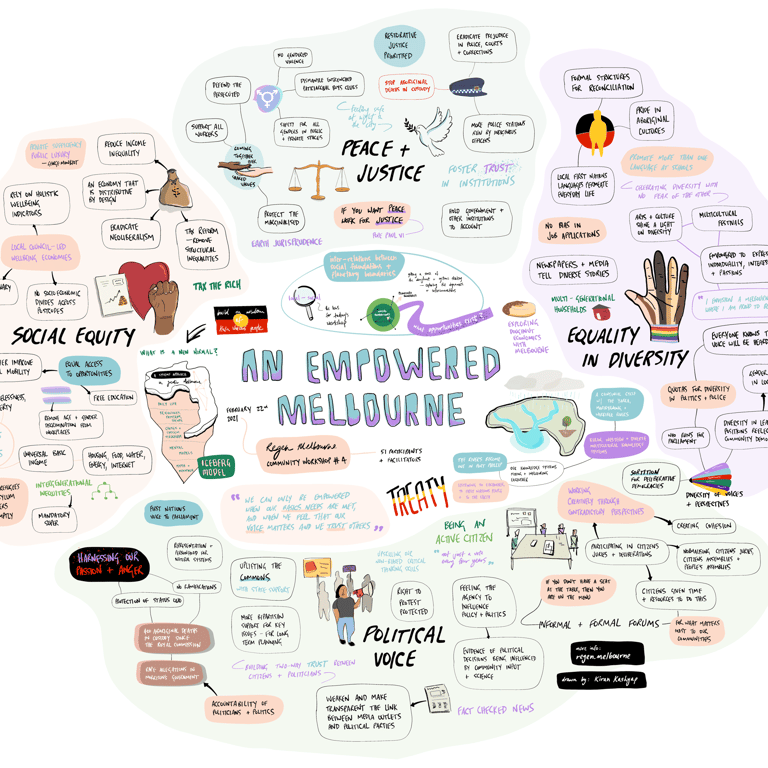
Delving into how we might measure these we looked at metrics suggested in the book, and examples from Amsterdam and California to see if we could find the same data for Sheffield.
We spent hours discussing the data and metrics. We faced the usual challenges with data disaggregation (geographies larger or smaller than we wanted), different time periods, unclear definitions or parameters.
In addition to this there were deeper questions about which metrics "made sense";
Should we be considering Sheffield in comparison to South Yorkshire, the UK or the world? Kate Raworth's book suggests a minimum income floor of $3.10/day; how would that be received in the city of Sheffield where the average income is 7% lower than the UK average?
Does it make sense to measure ecological ceilings at the city level? How do we measure ocean pH when Sheffield is one of the furthest UK cities from the sea?
With this in mind we recognise that the metrics and visualisation are a first attempt at understanding Sheffield in a more holistic way. Whist we have tried to be balanced in which metrics based on reliable data we chose, we recognise that this is not an objective exercise; our own biases and backgrounds have shaped which aspects of the social floor and ecological ceiling we have chosen to highlight and illustrate.
We also created the Sheffield snapshot in a very limited timeframe; over a period of three weeks we spent around 200 hours developing the doughnut. Because of the time constraints some data was excluded as we lacked the time to analyse it or verify the source. With additional funding, resource and wider community input the Sheffield Doughnut could tell a much broader and more realistic picture of Sheffield's economy.
What did we find?
how did we do it?
The interns' last day of the project is Friday the 25th April, which by stroke of luck coincides with Kate Raworth's headline talk at the Festival of Debate. I would really recommend joining, as well as Jason Hickel's event on the 29th April as they are both radical voices pushing for systemic change.
Myself and the interns will be at the Kate Raworth event and hope to share an illustration of the Doughnut we've created so far. Over coming weeks I plan to share and publish our process, metrics and doughnut snapshot.
To keep this work going it needs is funding. The University of Sheffield interns received a bursary for their work which has been a fantastic resource and support to get this project going. However to keep the momentum it needs seed funding for further research, community engagement and development. If you know of any funders that might be open to supporting this project please Get in touch.
If this project has inspired you, sign up to my newsletter for updates or get in touch directly.
this is where we need your help
We believe the Doughnut Snapshot should reflect the actual experience of people living in Sheffield, not just what data is easily available or what a small group has decided is "the right" metric.
We created the Sheffield Doughnut Snapshot to act as a provocation, a call to the community and a request for input. In the next week I'll share the summary table of indicators and metrics, their selection process and how these were illustrated in the Doughnut.
We invite feedback. comments, support, criticism from all and hope that by starting this work we can build momentum to create a Sheffield Doughnut Economics Coalition. This Coalition would shift the focus from narrow economic development goals to a more rounded understanding of human needs. It would also give us the tools and metrics to understand the city's impact on the ecology it relies upon.
what next?
The headline finding that 94% of social indicators are not being met and 85% of planetary boundaries are in overshoot are stark these findings are driven by the indicators and metrics chosen